Let's disrupt reality with technology, design & strategy


Designer & Strategist
Designing & implementing extended reality solutions and experiences ranging from corporate clients to medical applications and stand-alone installation experiences. Recently featured in Apple WWDC 2024 for Creative Direction on Echoes of the Wild -a flagship Apple Vision Pro app.

EXTENDED REALITY
Working with an emphasis on invisible user experience to ensure that these new-age technologies assimilate into our lifestyles seamlessly.
Scrutinizing every design choice based on human psychology and cognition in extended reality.
Designing & implementing extended reality solutions and experiences ranging from corporate clients to medical applications and stand-alone installation experiences. Recently featured in Apple WWDC 2024 for Creative Direction on Echoes of the Wild -a flagship Apple Vision Pro app.
Working with an emphasis on invisible user experience to ensure that these new-age technologies assimilate into our lifestyles seamlessly. Scrutinizing every design choice based on human psychology and cognition in extended reality.


Featured Projects


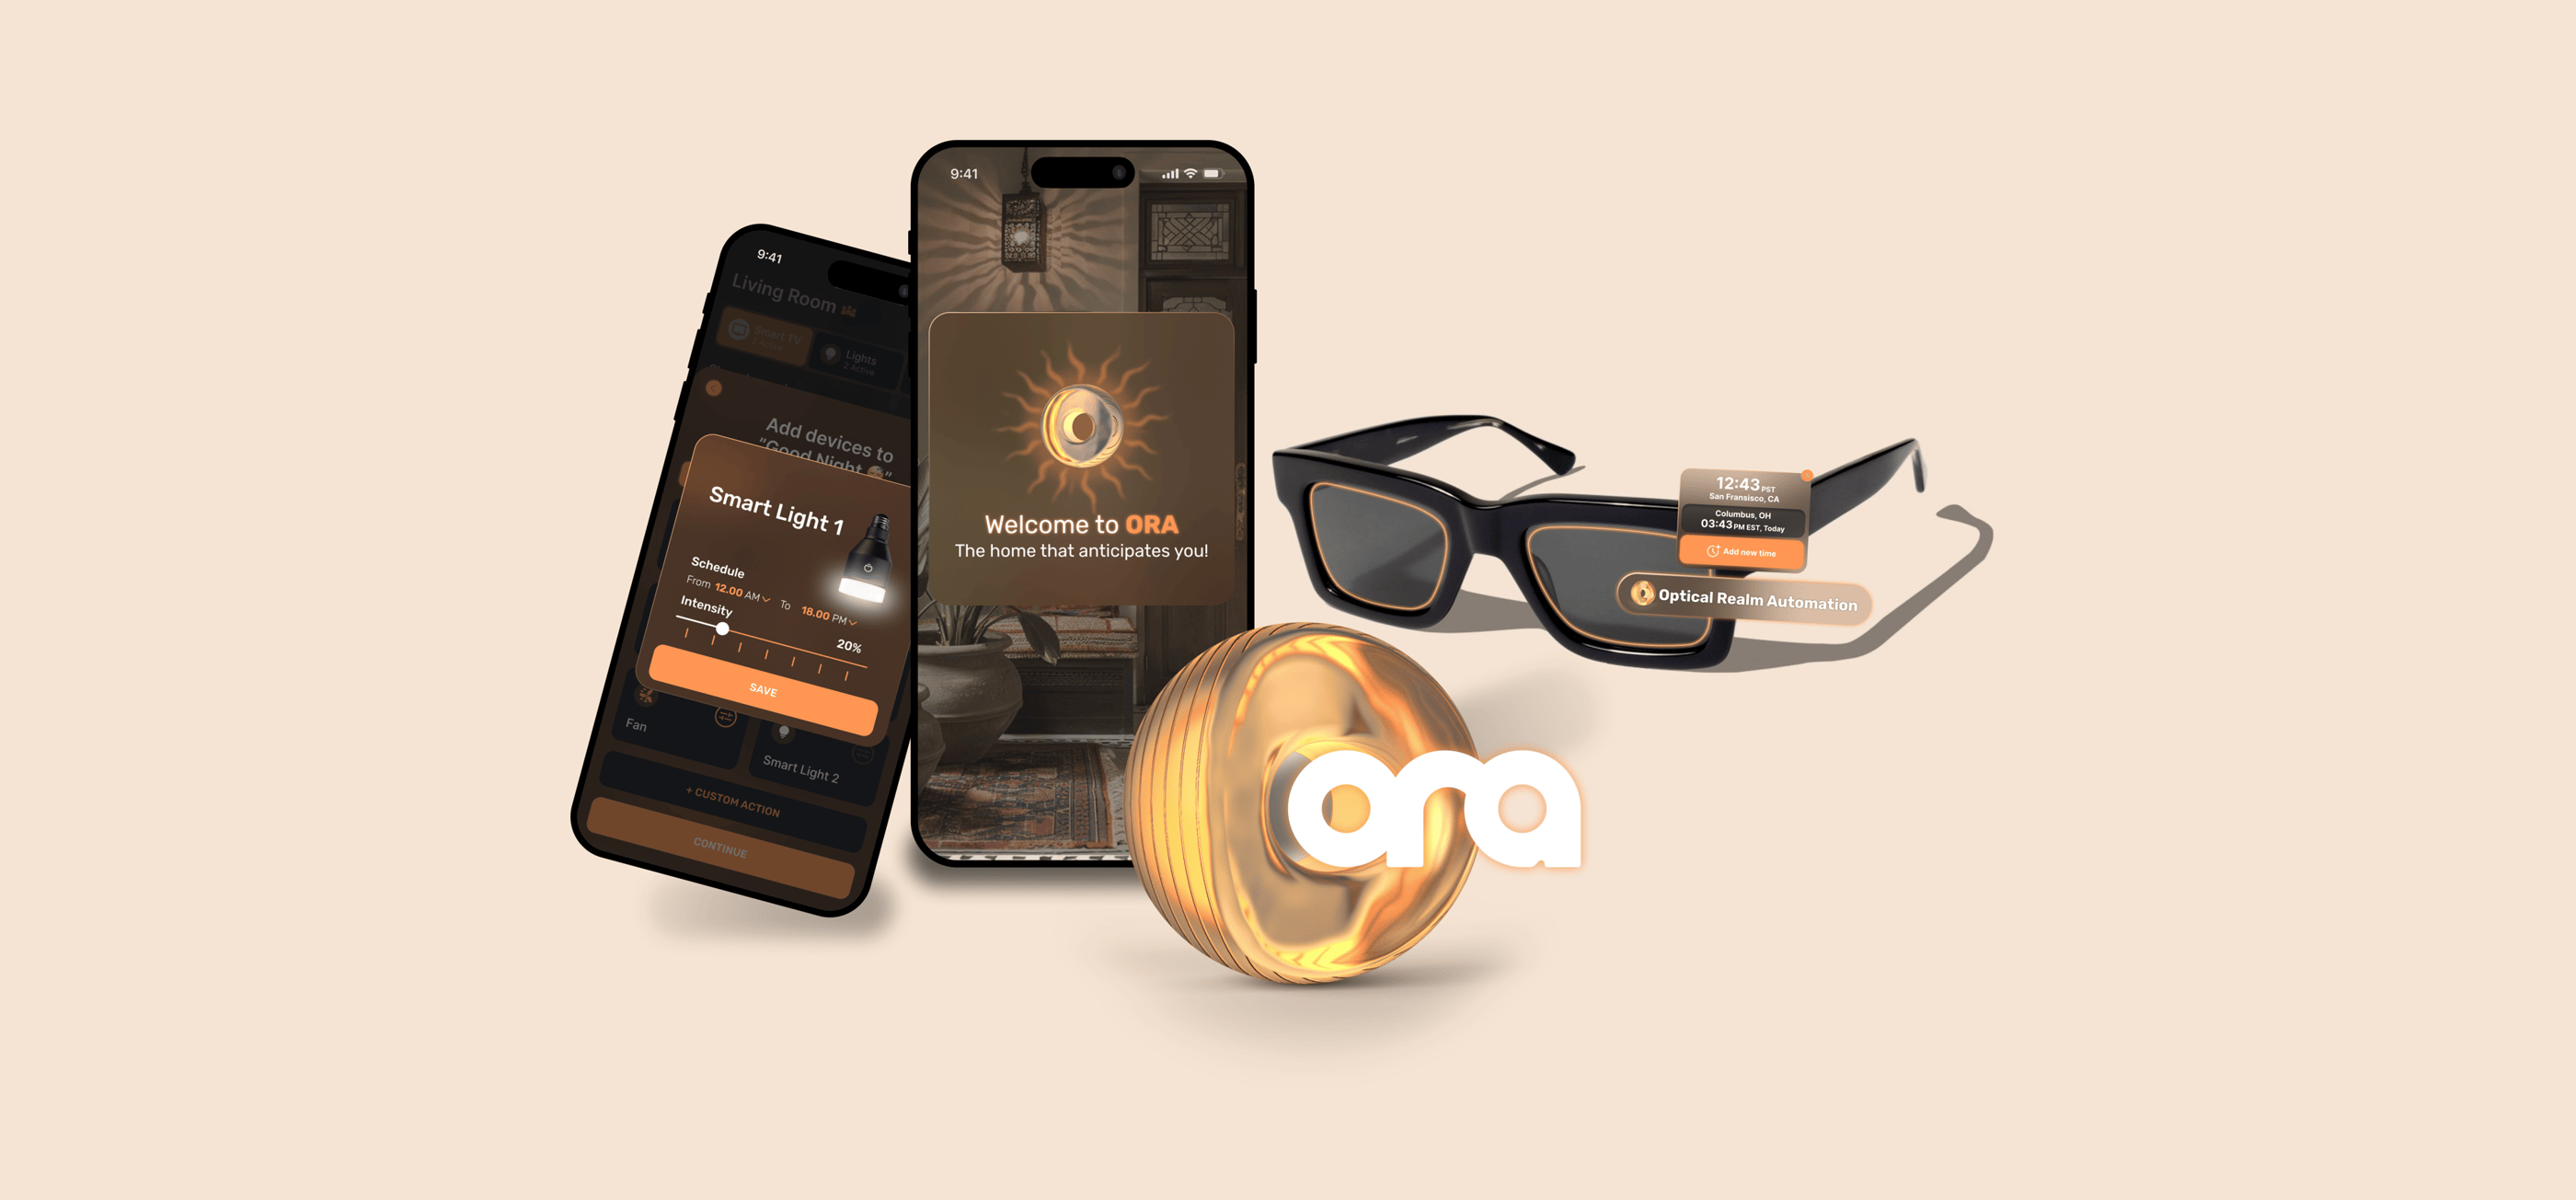
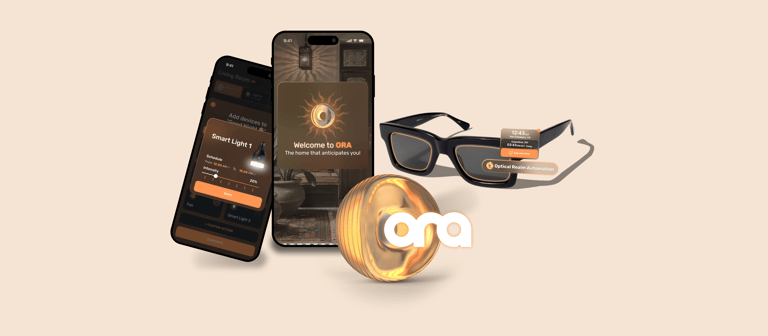
Mixed reality home automation system that integrates with matter-enabled smart glasses, offering seamless interaction with smart home devices using natural gestures, voice commands, and spatial intelligence. The project includes mobile and spatial UI components that optimize smart home experiences for individuals and multi-user households.
Tools: UE4, Figma, User research and testing, Iterative design, Mixed reality, Spatial UI Prototyping.
ORA
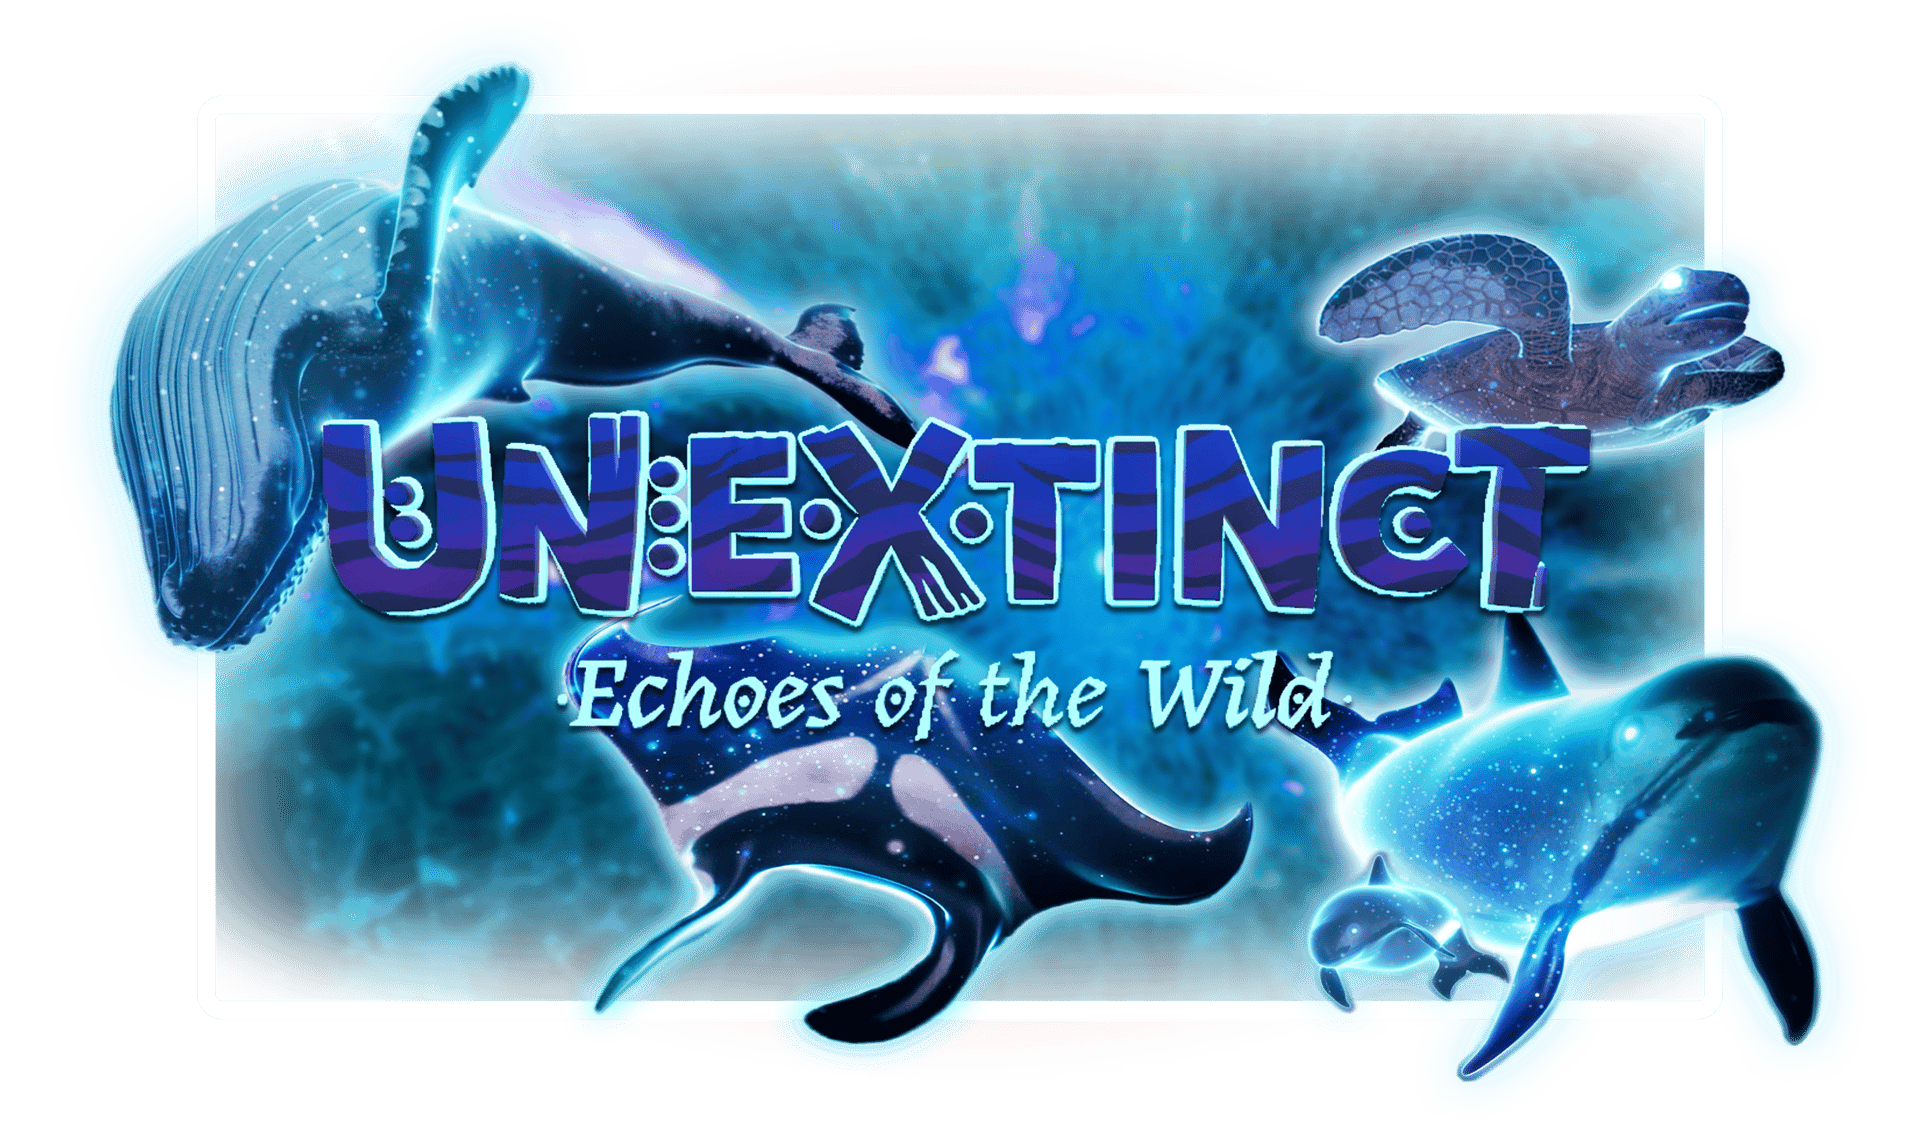
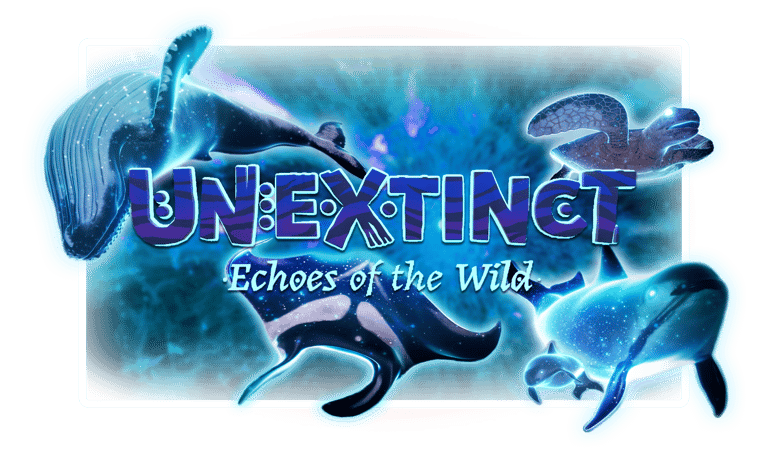
Apple Vision Pro experience that immerses players in the tales of extinct and endangered animals. Offering a transformative experience, merging the serenity of meditative exploration with the excitement of interactive gameplay.
Tools: Apple Vision Pro, Unity 3D, Reality Composer Pro, Figma, Photoshop.
Role: Creative Director | XR and UX designer
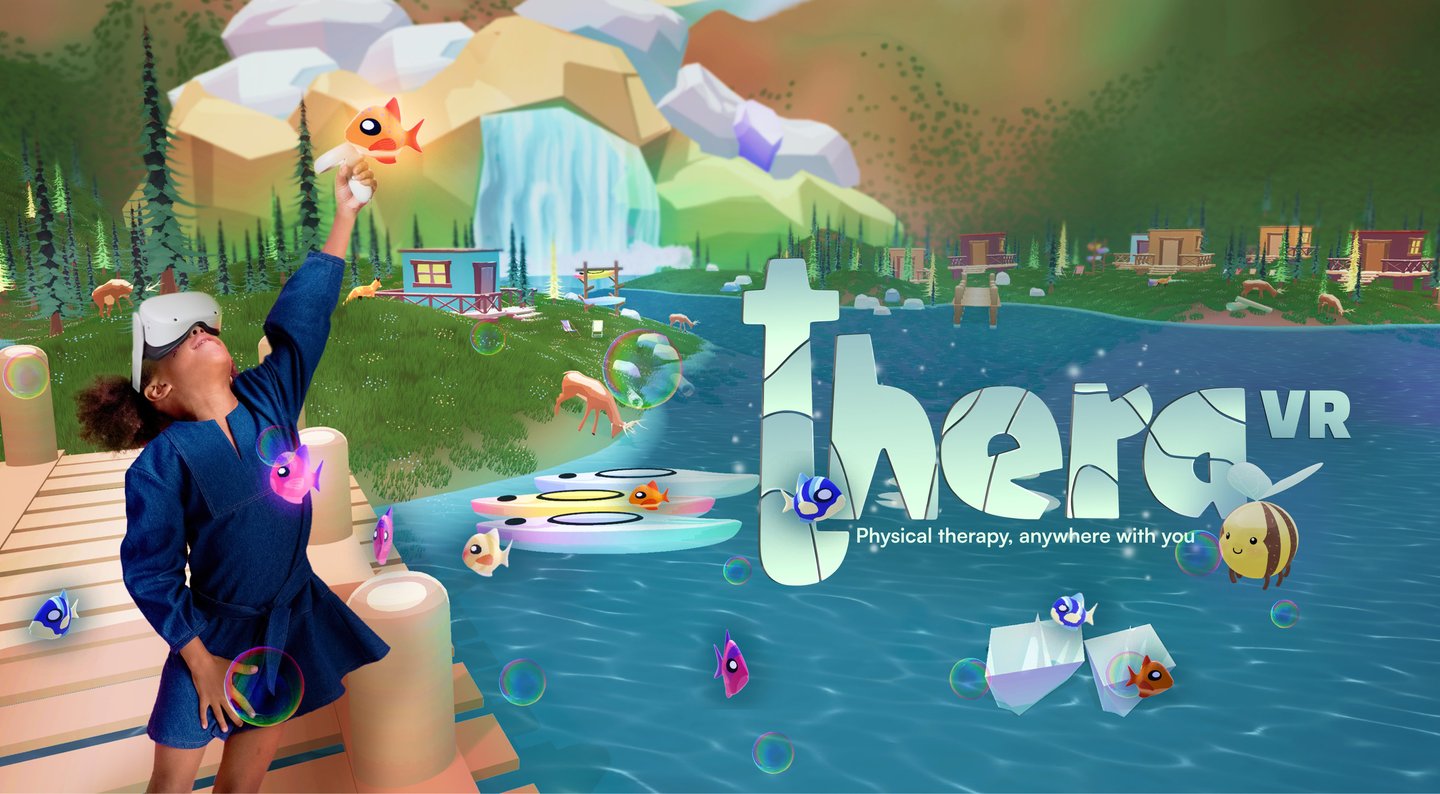
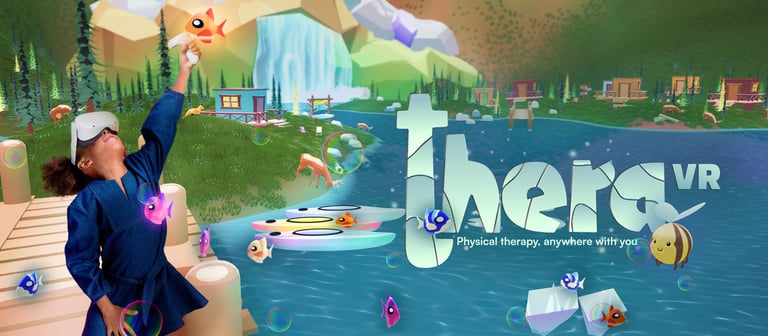
Virtual reality aid to physical therapy for children with neuromuscular diseases. Applying gamification to physical therapy by providing children with an adventure of a lifetime by giving them the agency to foster independence and wonder
Tools: UE4, Figma, User research and testing, Iterative design, Virtual reality, Medical VR


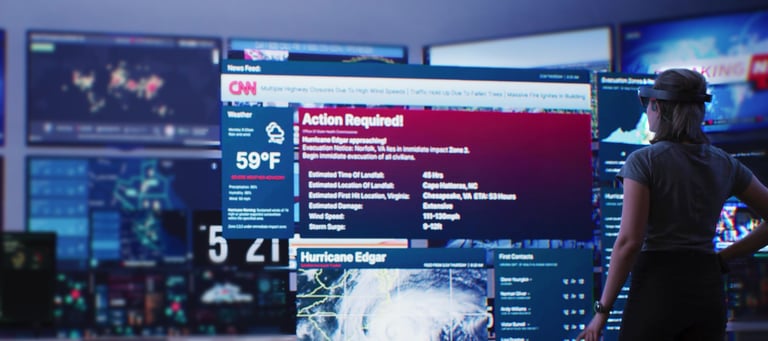
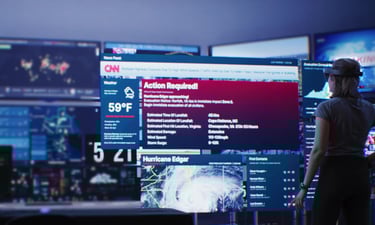
Reimagining situational awareness for decision makers by the implementation of MR technology and user-centered visual design.
Tools: Figma, XR virtual production volume, Microsoft Hololens 2, Unity
x SCADpro
Deloitte.


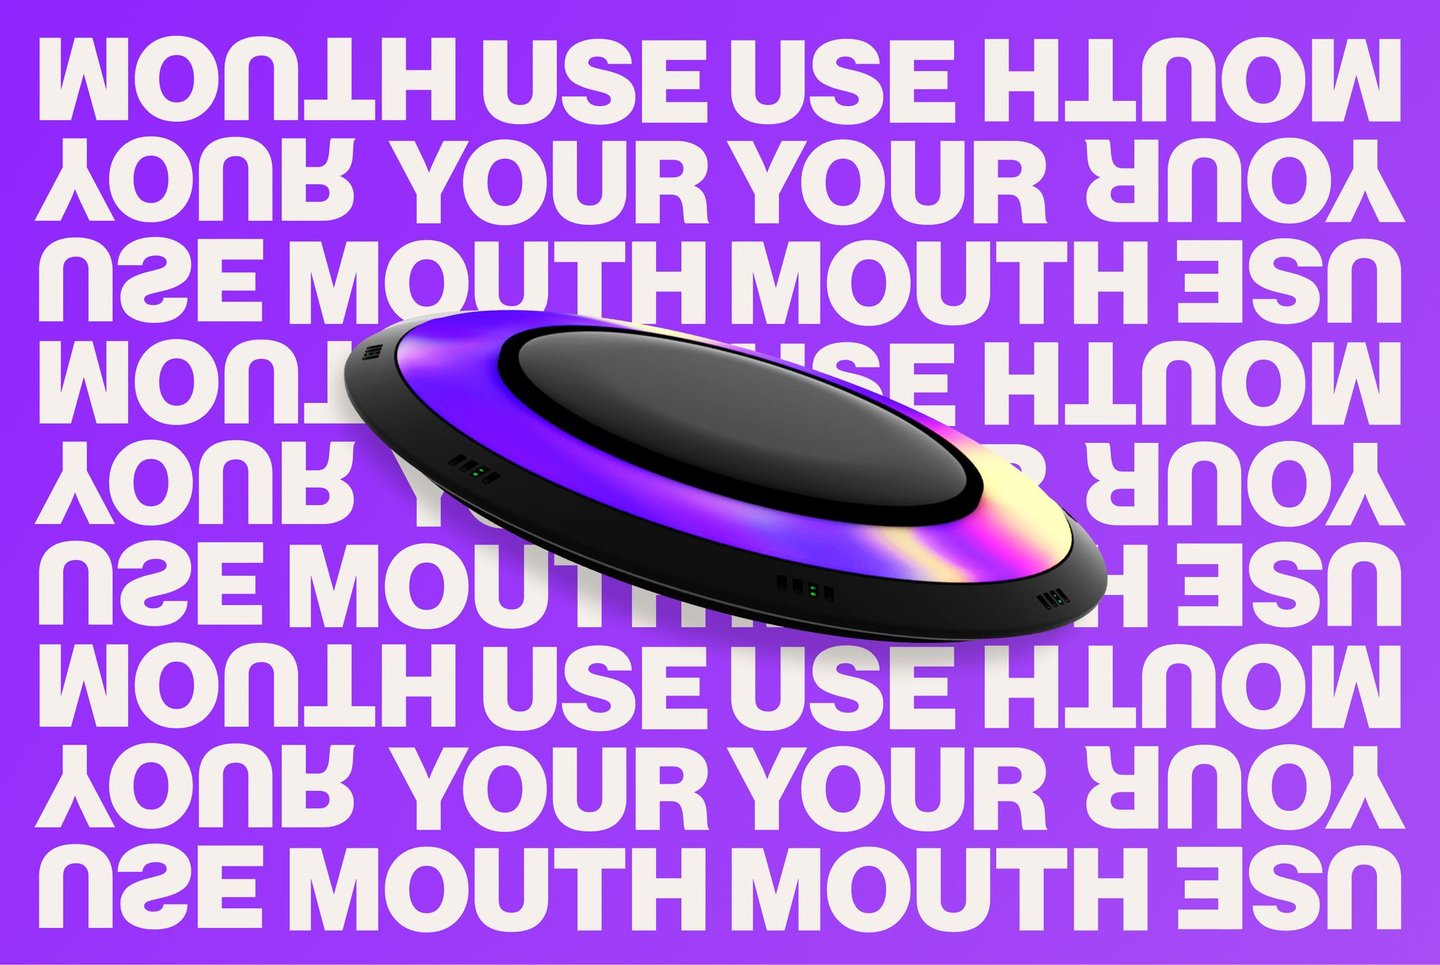
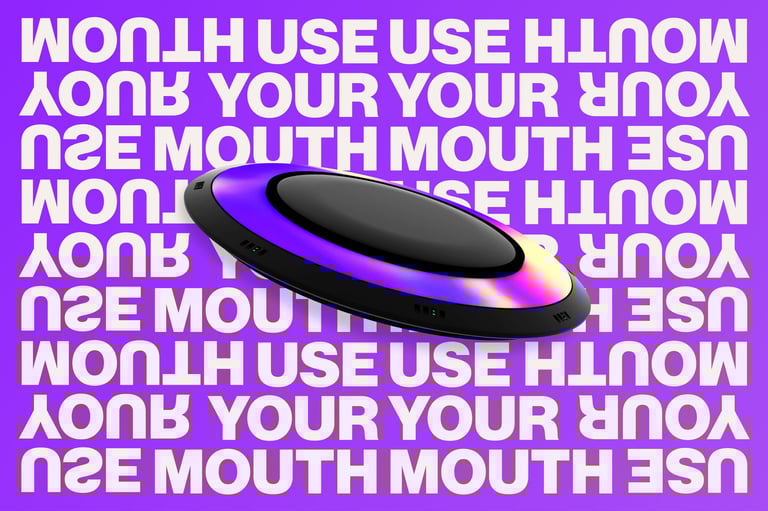

Use Your Mouth! attempts to create a humanized solution for increasing sexual competency in the youth, as well as older generations brought up on misinformation and stigma through stimulating a space for information exchange between people on the topic to educate and empower each other.
Tools: UE4, XR Virtual Production, Realtime motion capture, Perception neuron suit, Virtual Reality, Metaverse


A short film produced on an XR virtual production volume. Virtual environment and set design.
Tools: Unreal Engine, Substance, Quixel Suite, Maya, Da Vinci pro
Role: Art Director | Technical Artist

UNEARTHED


Led a team of 10 designers to create user-focused solutions to reimagine situational awareness in decision-making bodies for Deloitte.
Focusing on the usability of new technologies forced us to critically evaluate the need and necessity of headsets in comparison to the value they add. Our job was to tip the balance based on concrete justifications for their use and design intuitive and efficient interfaces.
Tools: UE4, Figma, XR virtual production, Spatial design, MR with Hololens 2, Bone conduction, etc

x SCADpro


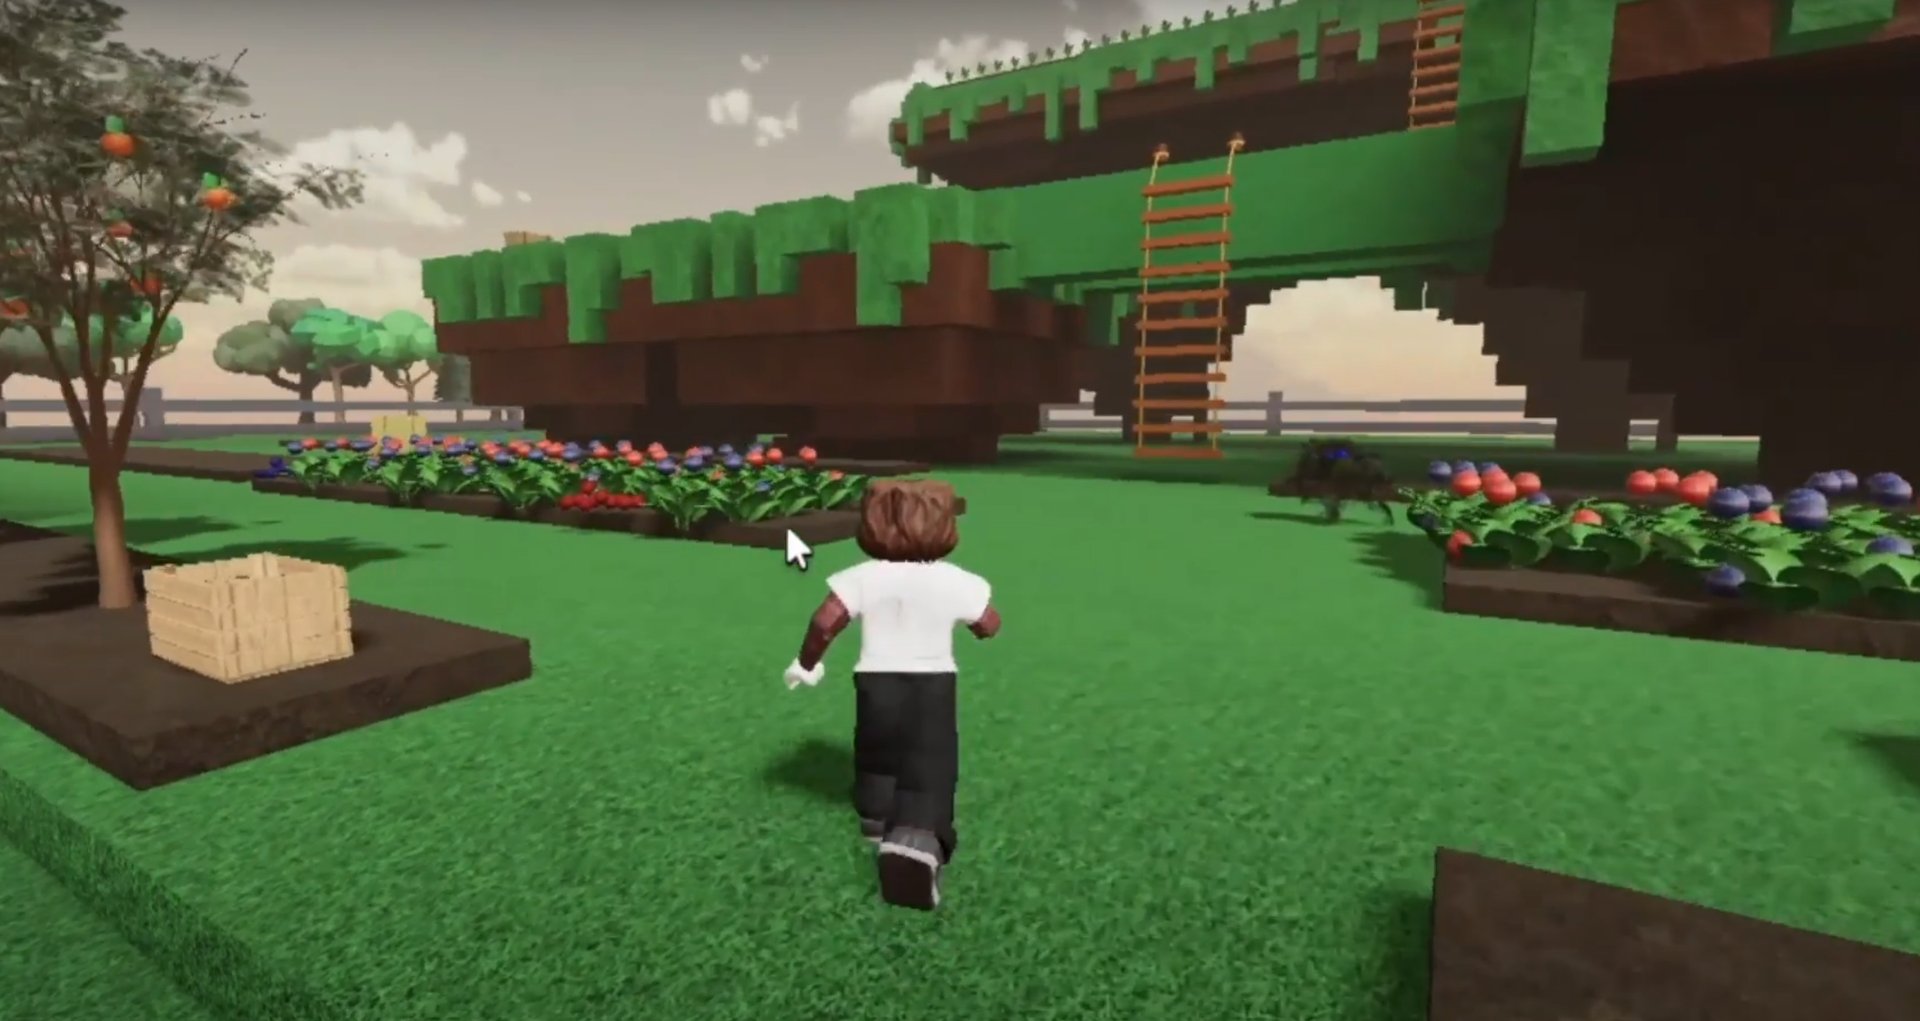
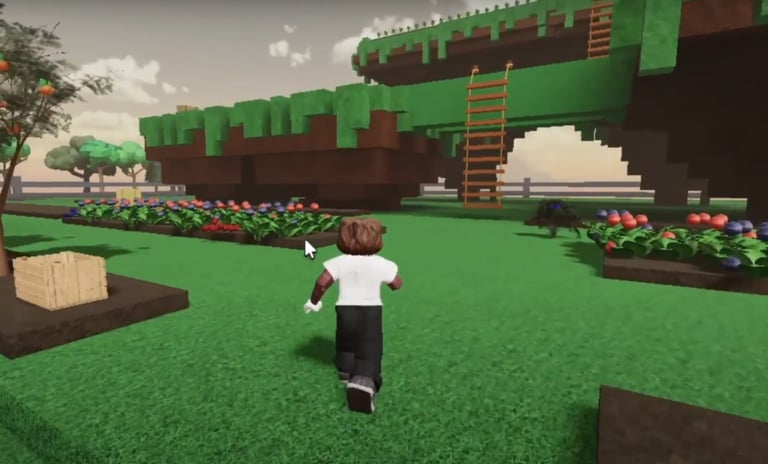

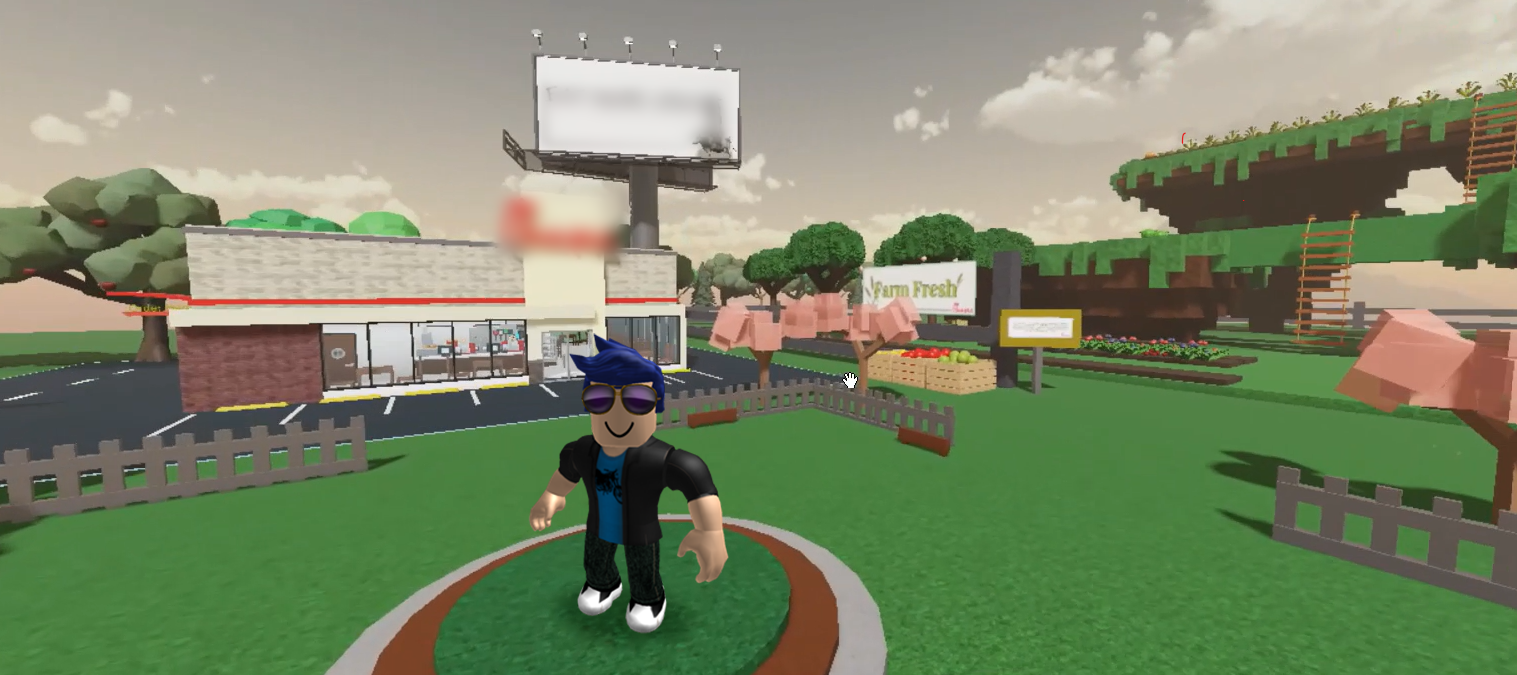
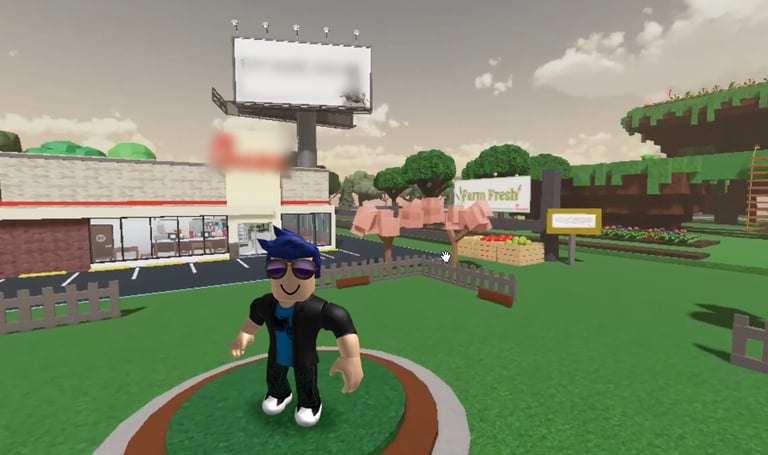
Worked on 2 short projects with Sogeti (part of Capgemini) Customer First practice to design and prototype gamified experiences for a large quick-service restaurant chain as well as design the potential approaches to Capgemini’s own internal metaverse applications, developing a working proof of concept for both.
Tools: Unity 3D, Roblox editor, Blender, User research, Stakeholder research, C# & Lua scripting, Virtual reality
*Under NDA
The first step lay down the company’s goals, values and missions. After establishing the anticipated user behavior these entities hoped to achieve from their web 3.0 ventures, working backward to create gamified experiences in virtual reality as well as gaming platforms like Roblox to engrain conscious and subliminal brand recognition and loyalty in the users. Bringing them back to the experiences and expanding their modes of engagement with the brand.
Along with this, I delved into deeper research to establish use cases and applications of the metaverse, Web 3.0 and emerging technologies for corporations.